7. Process
7.1 Steps
Iterate through each user provided Ensembl transcript id:
Retrieve EPO aligned orthologous sequences from Ensembl database for user-defined species group (mammals, primates, fish, sauropsids) for promoter of user-provided transcript id, between user-defined TSS-relative start/stop sites.
Edit retrieved alignment:
- Replace characters not corresponding to nucleotides (ACGT), with gaps characters “-“.
- Remove gap-only columns from alignment.
Generate position weight matrices (PWMs) from Jaspar position frequency matrices (PFMs).
Score target species sequence using either all or a user-defined list of PWMs.
Keep predictions with a log-likelihood score greater than score threshold corresponding to p-value of 0.001, or user-defined p-value.
When experimental data is available for the target species, score each of the following for the target sequence region:
- DNA sequence conservation in homologous mammal species sequences
- proximity to CAGE-supported transcription start sites (TSSs)
- correlation of expression between target gene and predicted transcription factor (TF) across 1800+ samples
- proximity to ChIP-Seq determined TFBSs (GTRD project)
- proximity to qualitative trait loci (eQTLs) affecting expression of the target gene (GTEX project)
- proximity to CpGs
- proximity to ATAC-Seq peaks (ENCODE project)
Compute ‘combined affinity score’ as a sum of scores for all experimental data.
Sort target_species predictions by combined affinity score, generate a vector graphics figure showing the top 10 (or user-defined) unique TFs mapped onto the promoter of the target transcript, and additional output as described below.
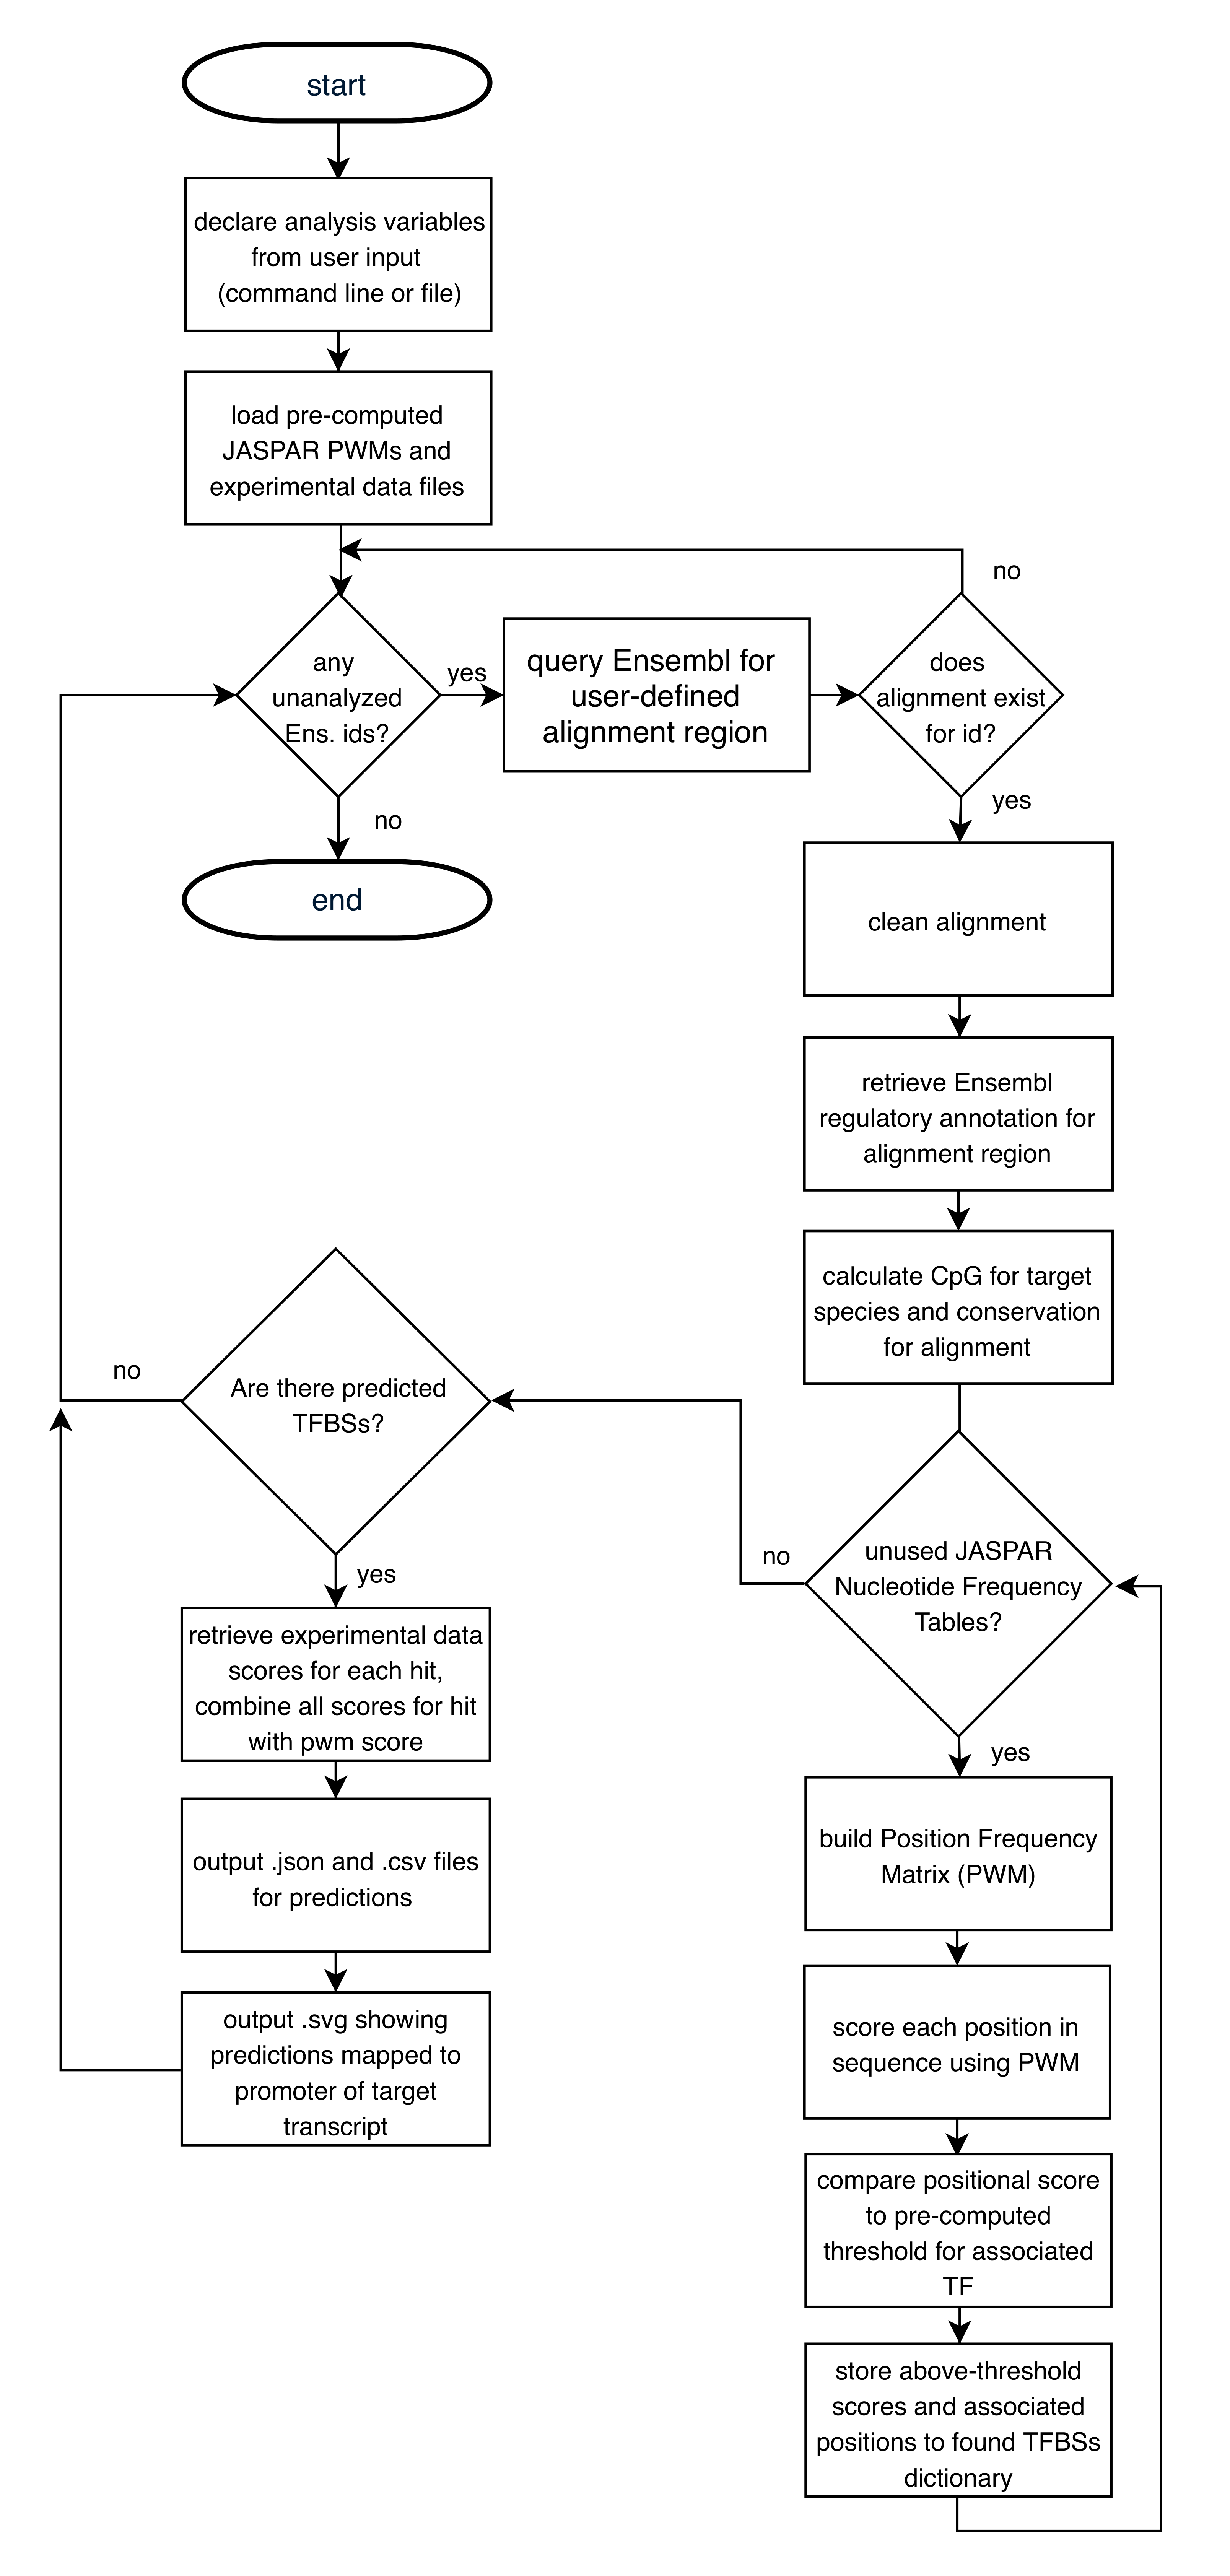
7.2 Flowchart