4. Output
4.1 Promoter Figure
- Output name format - [Ensembl_transcript_id]_([nt_before_TSS]_[nt_after_TSS])_[species_group]_[species_coverage]_[pvalue].Promoterhisto.svg.
- Figure Title (left) - Ensembl gene name and Transcript ID.
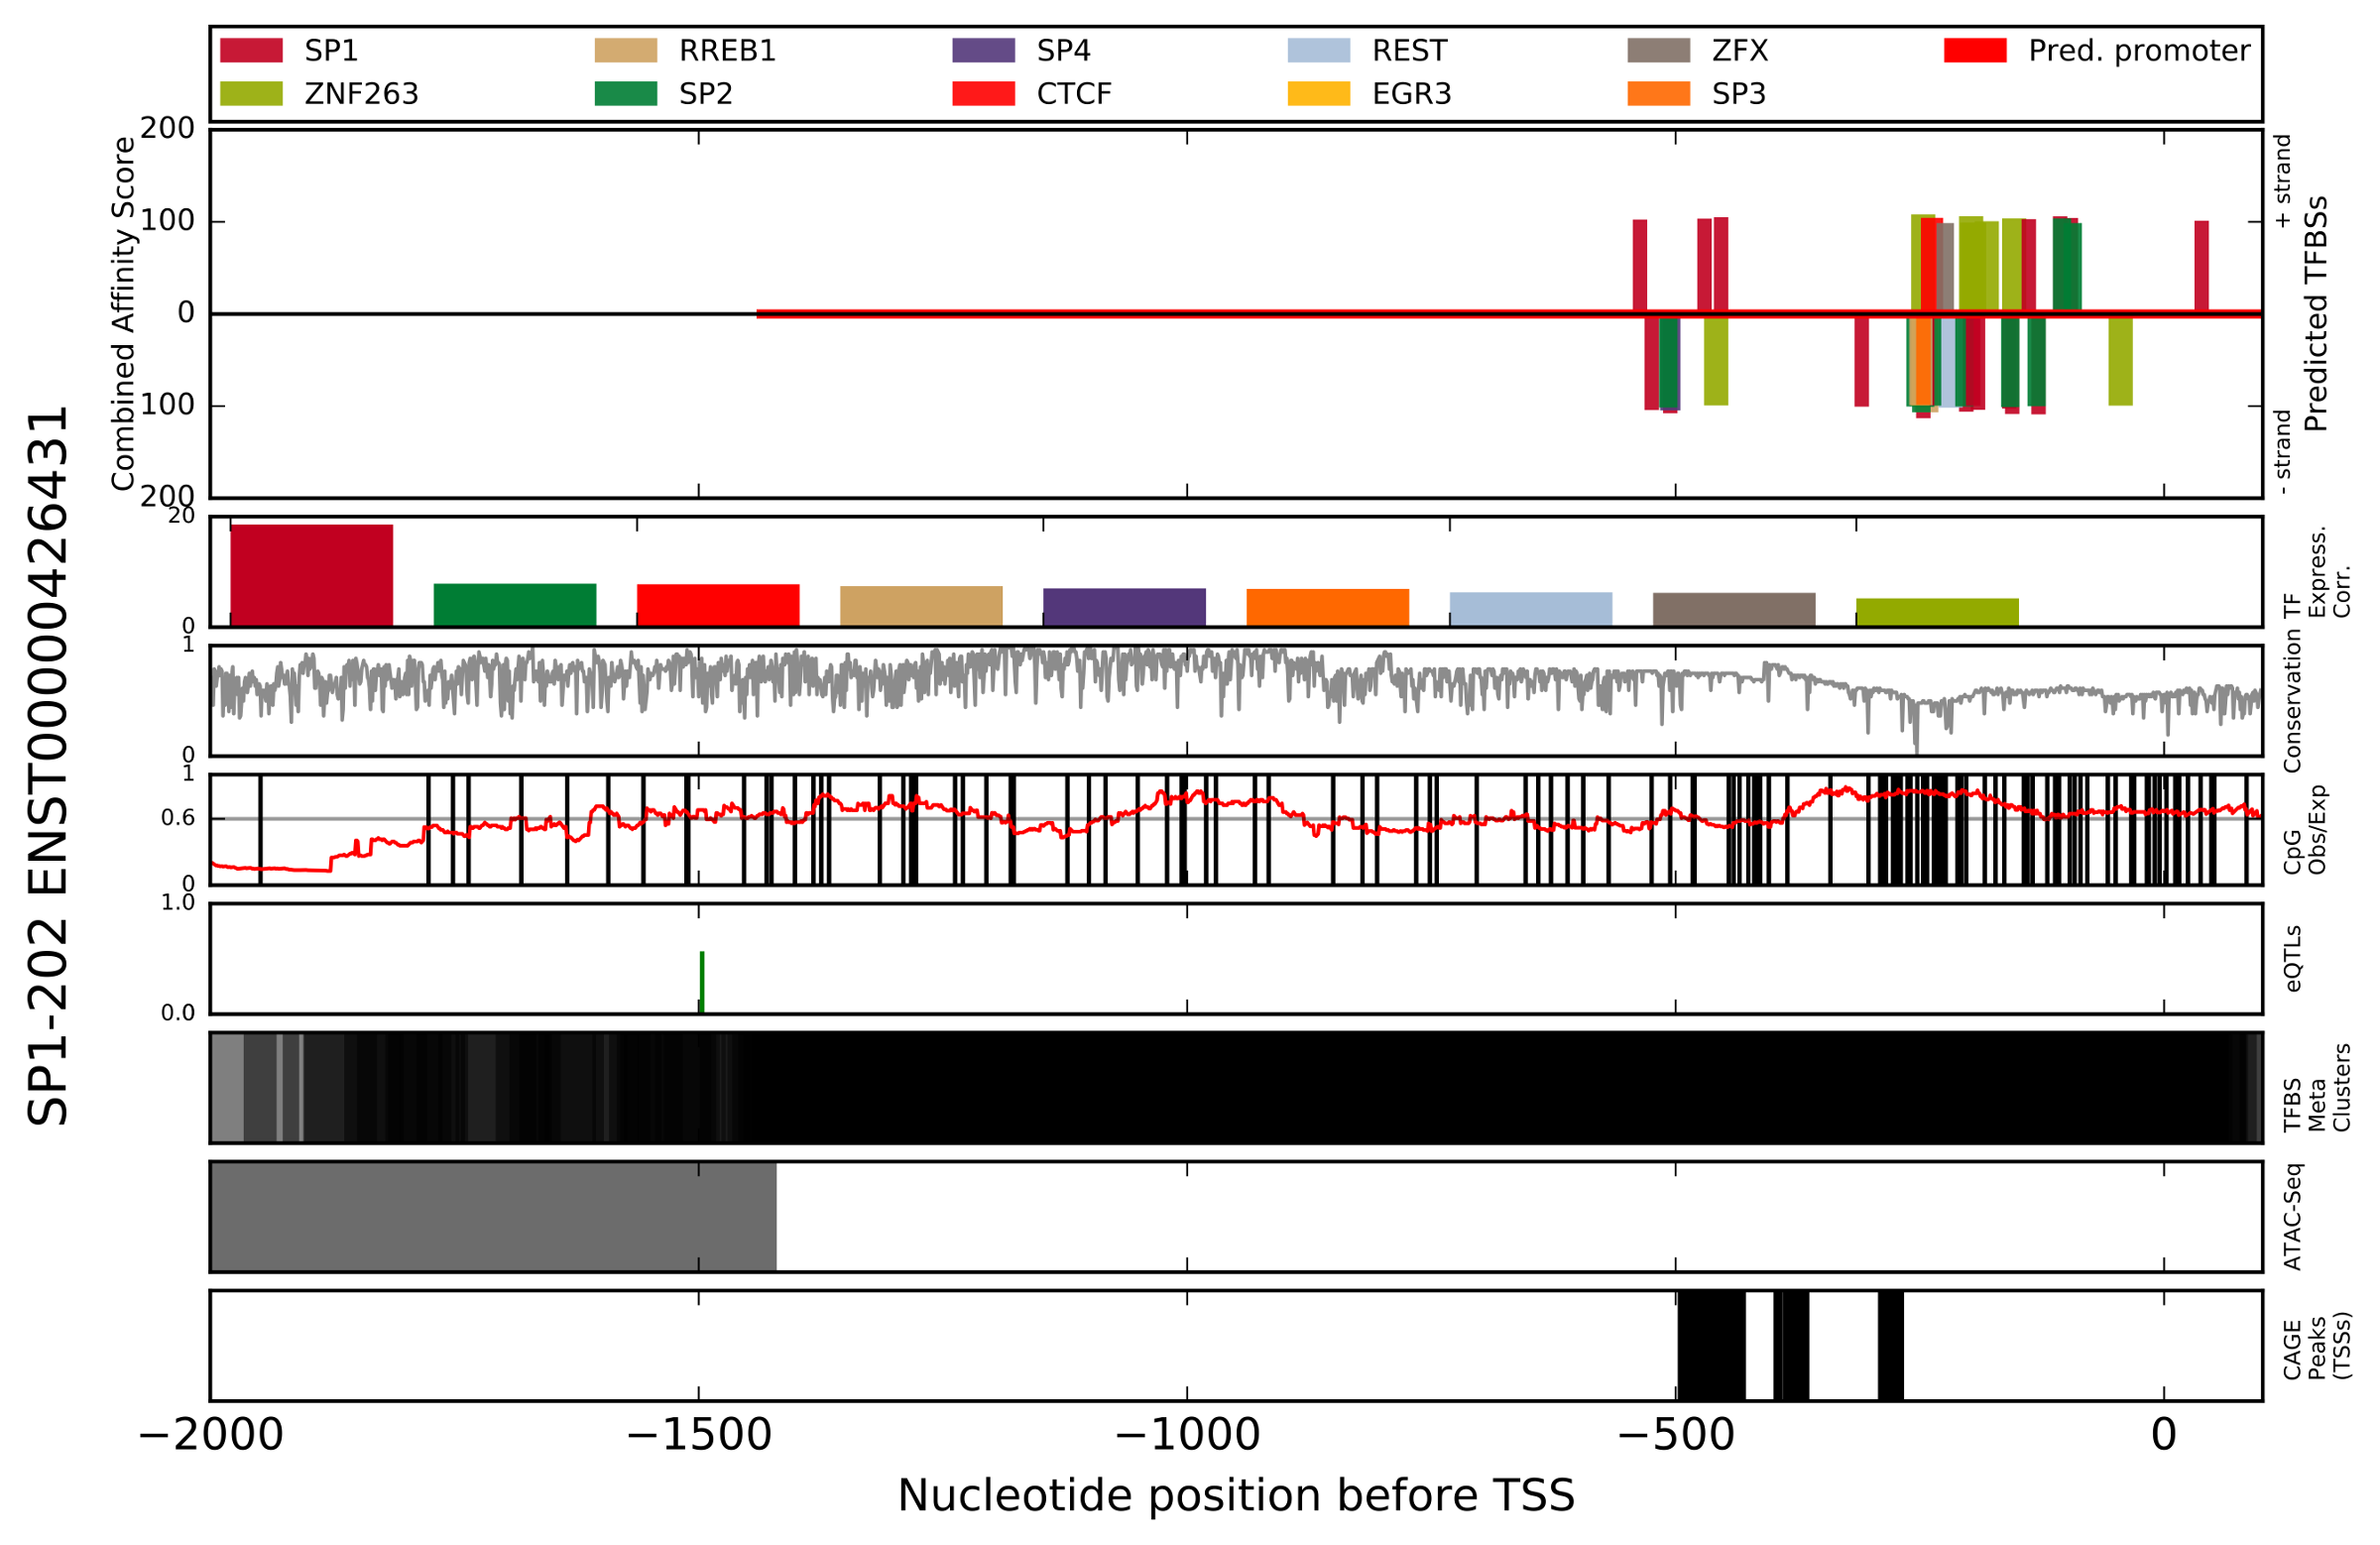
- Predicted TFBSs - Depicts the region analyzed in this analysis. Bars displayed on the positive y-axis indicate TFBS predictions made on the positive (+) DNA strand. The legend of colors is located directly above, and correlates colors to the TF which is predicted to bind. Combined affinity score is the summation of scores for the seven characteristics scored by the TFBS Footprinting tool (see 1. Introduction). Using the x-axis values at the bottom of the figure, the x-axis indicates nucleotide position relative to the TSS (e.g. -1000 is 1000 nt upstream of the TSS).
- TF Expression Correlation - For the TFs with the highest combined affinity scores, the correlation of expression with the target gene has been determined and is presented in descending order of log-likelihood score. The color legend is the same as the Predicted TFBSs subplot, and is located at the top of the figure.
- Conservation - A measure of the conservation at each position in the alignment.
- CpG Observed/Expected - Indidents of CpG (Cytosine-Phosphate-Guanine) are indicated with a vertical black line. A line plot in red indicates the ratio of actual to expected CpGs (by chance alone) in a 200 nt window.
- eQTLs - Locations of eQTLs identified in the gTEX project which affect the target gene. Green bars on the positive y-axis indicate eQTLs assocaiate with enhanced expression of the target gene, while red bars on the negative y-axis indicate those associated with reduced expression. The magnitude of the bars indicates the projected effect on gene expression.
- TFBS Meta Clusters - Locations of TFBS metaclusters representing clusters of experimentally identifed (ENCODE and SRA databases) TFBSs which have been compiled by the GTRD project.
- ATAC-Seq - Locations of ATAC-Seq peaks identified by ENCODE experiments representing open chromatin.
- CAGE peaks (TSSs) - Locations of TSSs identified by CAGE in the FANTOM project.
4.2 Table of predictions
All predicted TFBSs for target species which are supported by at least conservation_min predictions in other species, sorted by combined affinity score (TFBSs_found.sortedclusters.csv).
- binding prot - Gene name of protein predicted to bind.
- species - Name of target species.
- motif - DNA sequence of target species which is predicted to be bound by the binding protein.
- strand - Positive or negative strand of DNA.
- start - Location in unaligned target species sequence of the start of the motif.
- end - Location in unaligned target species sequence of the end of the motif.
- TSS-relative start - Location relative to the TSS of the start of the motif.
- TSS-relative end - Location relative to the TSS of the end of the motif.
- frame score - Log-likelihood score of the prediction of the binding of the TF.
- p-value - P-value corresponding to the frame score.
- pos in align. - Location in the aligned target species sequence corresponding the start of the motif.
- support - Number of species in alignment.
- combined affinity score - Summation of all scores for this motif/prediction.
- species weights sum - Information content of the alignment at the locations occupied by the TFBS.
- cage weights sum - Summation of log-likehood scores for the CAGE peaks near the predicted TFBS.
- eqtls weights sum - Summation of log-likehood scores for the eQTLs peaks near the predicted TFBS.
- atac weights sum - Summation of log-likehood scores for the ATAC-Seq peaks near the predicted TFBS.
- metacluster weights sum - Summation of log-likehood scores for the metacluster peaks near the predicted TFBS.
- cpg weight - Log-likehood score for the CpG obs/exp ratio at the center of the predicted TFBS.
- corr weight sum - Summation of log-likehood scores for correlations of expression between transcripts of the predicted TF and those of the target gene.
4.2 Addtional outputs
- Original alignment as retrieved from Ensembl (alignment_uncleaned.fasta).
- Cleaned alignment (alignment_cleaned.fasta).
- Regulatory information for the target transcripts user-defined promoter region (regulatory_decoded.json).
- Transcript properties for target transcript (transcript_dict.json).
- All predicted TFBSs for the target species which satisfy p-value threshold (TFBSs_found.all.json).